Participation
The Participation page on the Researcher Dashboard shows you an overview of all the participants in your study, including the ones who are participating and those who have been invited. On this page, we will walk you through the Participation and Pending Invitations tabs as well as explain the actions that you can perform.
Participation Tab
The Participation tab provides you with a table where you can see a list of all the participants of your study, whether enrolled or dropped out. This table displays additional information related to your participants which will be explained below.
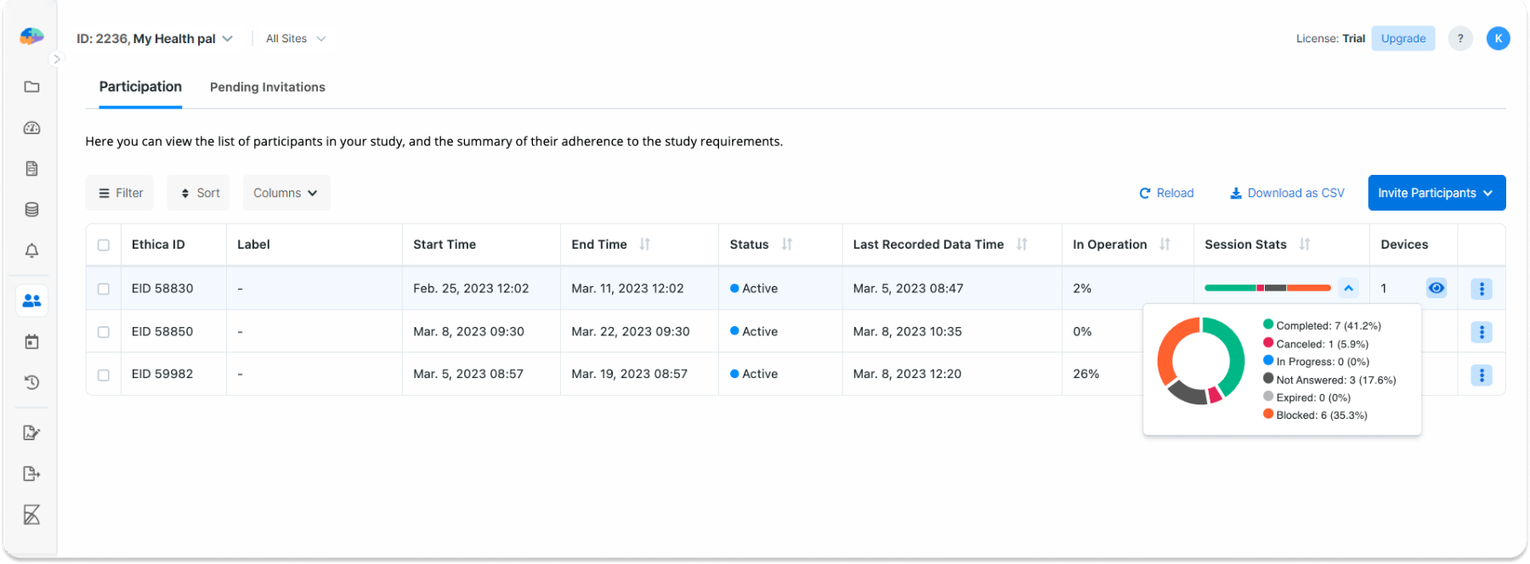
Each row of the table contains the following Columns:
- Avicenna ID: This is the participant's ID in Avicenna.
- Start Time: This shows the calculated Participation Start Time for your participants.
- End Time: This shows the calculated Participation End Time for your participant.
- Label: This shows the label you have assigned to a particular participant. Labels help you better identify participants within the study.
- Status: This shows you whether the participant is active or dropped out of the study.
- Last Recorded Data Time: This shows the last time when Avicenna received sensor data from a participant, or when an activity session for the participant was completed, canceled, expired, or blocked.
- In Operation: If your study includes sensors, this column displays the percentage of the time that the app was running and collecting sensor data from a given participant. For example, in the image above, the participant with ID 59982 has collected sensor data 26% of the time using their app(s).
- Session Stats: This shows statistics on the status of the sessions (with a past scheduled time) related to a given participant, which can be seen as a summary of their adherence to the Activity requirements. In the image above, you can see that the participant with the ID 58830 has completed 7, canceled 1, and not answered 3 sessions. The remaining 6 sessions of this participant have a Blocked status. Please refer to Activity Sessions for more details on sessions and what statuses they can hold.
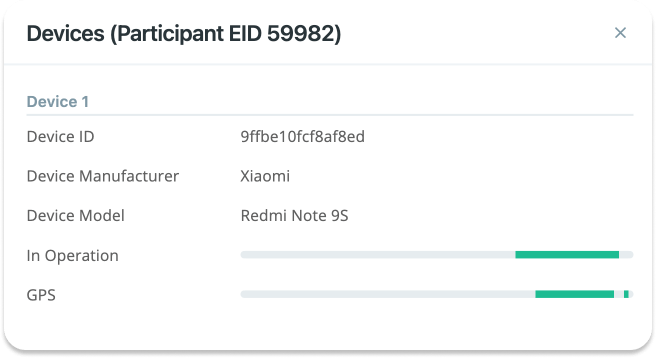
- Devices: This column gives you the number of devices that are used by the participant. By clicking on the eye-shaped button, you can see the list of devices. For each device, the list shows a unique identifier. Each data record received from a given participant is tagged with the relevant device ID. So when analyzing the data, you can see which device was used to upload which data. Furthermore, for each device, you can see the model and manufacturer as seen in the image below.
In Operation Event Plots
If your study records sensor data, when a participant joins your study, the Avicenna mobile app will continuously run on their phone behind the scenes and collect the requested data. The app also sends a report to the Avicenna server on how often it was running and collecting data, and how often it was terminated, for example by the participant or due to the phone being turned off.
The In Operation shown for each device can give you a good estimate of when the app was running on the participant's
phone, and when it was not. For example, in the image above, you can see that the app was running for a short time on
the Xiaomi device.
Sensor Event Plots
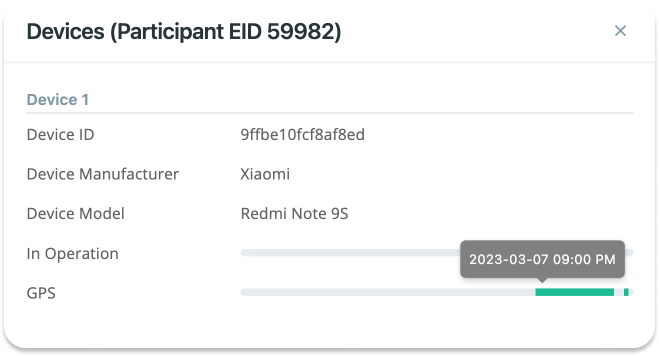
The sensor event plots show when sensor data exists from a certain device (colored region), and when it does not (gray region). As you hover the mouse over the plot, a tooltip appears to show the time which that part of the plot presents. If the area under the mouse is colored, it means that the participant has uploaded the relevant sensor data during this time window from the specified device. If there is no sensor data collected and received from a specific device, instead of a plot you'll see "No Data".
Data Filtering
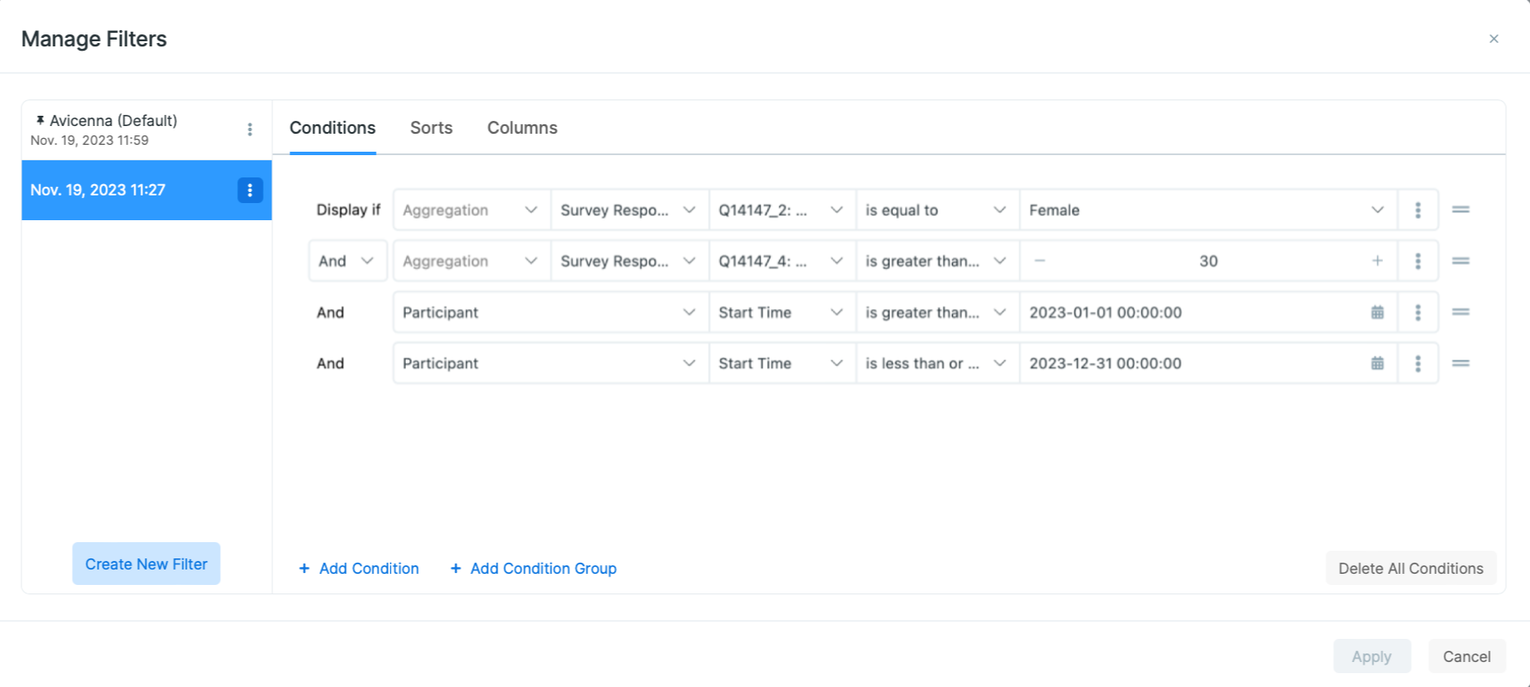
You can use the Filter button to set conditions, sort, and specify which columns you want to see for each participant. Finally, you can export and download the list of participants based on what you see in a CSV file format. On the Participation page, you can filter the data based on many different fields in different categories including Participant, Devices, Sessions, Survey Responses, and Notifications. See the Data Filtering for how to use this feature.
Participant-related Actions
In the Participation tab, it is possible to perform several actions, including Edit Label,
Modifying Participation Period, Reload Devices, Set as Test Participant, Change Site, Drop from Study, and
Delete. You can perform some of these actions on multiple participants by selecting them first and then clicking the
desired action on the table header.
Modify Participation Period
When a given participant joins your study, the Avicenna app calculates their individual Participation Period.
You can see the Participation Period for a given participant in the table labeled as Start Time and End Time. For
example, in the image below, Participant ID 58830 joined the study on Feb. 25, 2023, and will be part of the study
until Mar. 11, 2023.
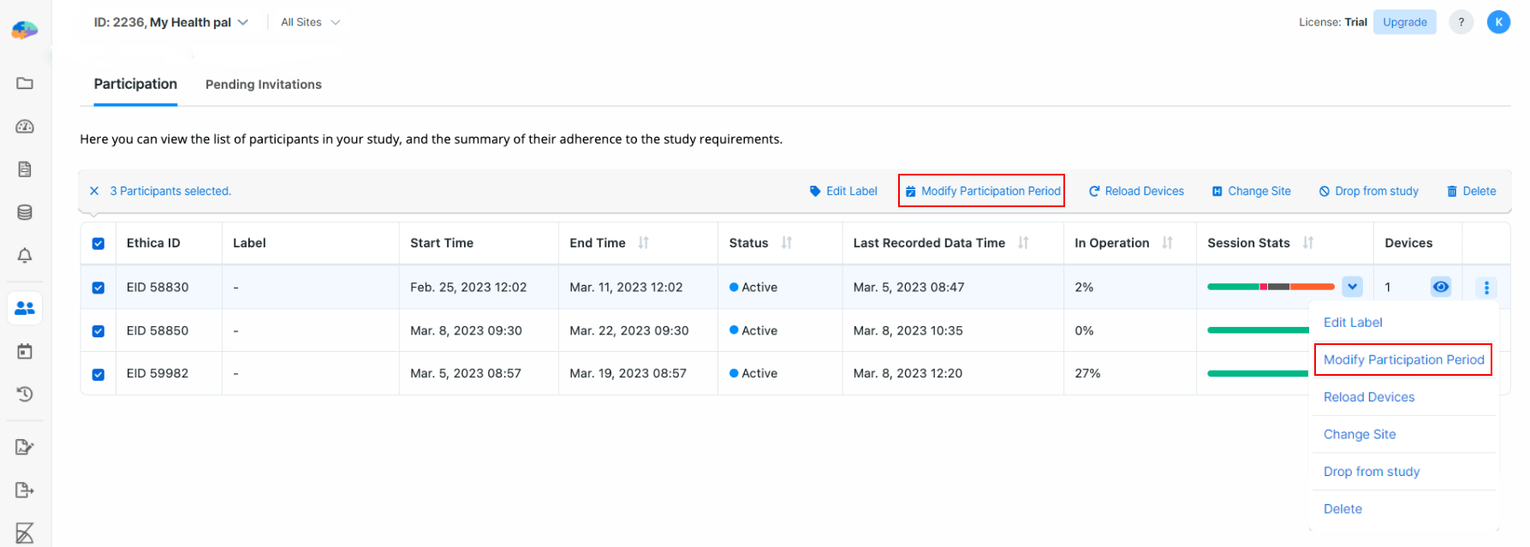
You can modify this period for one or more participants by selecting the intended participants and clicking on the
Modify Participation Period button. Alternatively, for each participant, you can click the ellipsis menu to the right
of the table to access the actions available. Note that this solution can only be applied to one participant at a time.
After selecting the participants, set a new start and end date from the dialog, and then click on Save.
When you modify the Participation Period for a given participant, Avicenna automatically adjusts their Activity sessions based on the new period. For example, if you set their Start Time to a later time, the responses provided prior to this time will not be accessible anymore. Or if you reduce the End Time, the sessions scheduled after the new End Time will be removed. You must be cautious about how you are modifying this period.
On the other hand, when the Participation Period is modified, Avicenna won't delete collected sensor data for the participant, no matter what the new Start Time and End Time are.
Reload Devices
Avicenna apps for Android and iOS are capable of working offline. To do so, occasionally the app connects to the server, downloads all study settings, and uses those settings as the basis for its operation.
If you modify the study settings while participants are already enrolled in the study, you might make those settings
invalid and out of date. You can wait for each participant's app to sync itself with the latest changes, but this
periodic reload can take about 30 days if nothing else causes a reload.
Alternatively, you can initiate this sync yourself. To reload the participants' devices, go to the Participation page on
the Researcher Dashboard, select the participants, and click on Reload Devices.
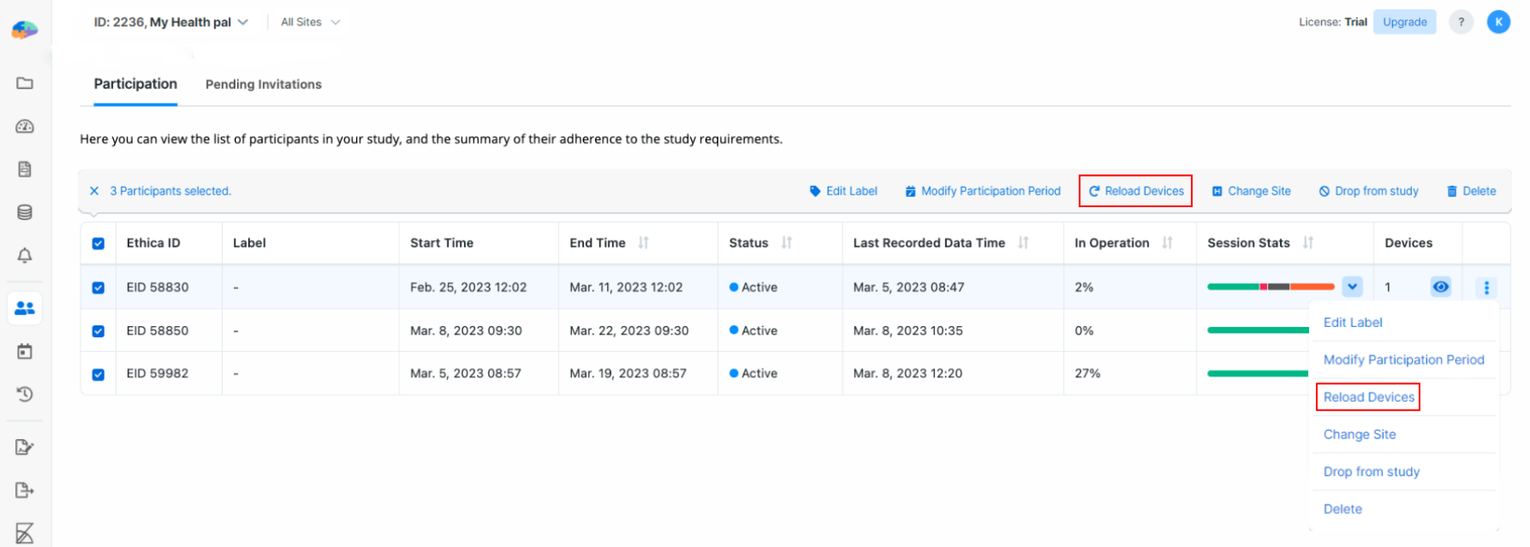
Doing this will instruct Avicenna to send a message to the participants' devices and perform the reload. The message is often received by the app right away, or in case they are offline, as soon as they become online again.
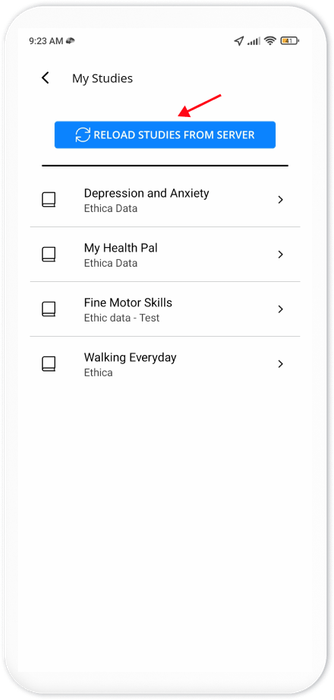
An alternative solution is to ask participants to reload studies from their Avicenna app. To do so, they should open the
Avicenna app and click on Settings. Then, they need to tap the My Studies. Finally, they need to press the
RELOAD STUDIES FROM SERVER button to reload the latest study details from the server.
Change Site
For multi-site studies, researchers can change the site associated with one or more participants. This might be needed if a participant moves to a different location or there was an error during their initial enrollment.
To change the site for the participants:
- Select the intended participants.
- Click on the
Change Sitebutton. - From the dialog that appears, choose the new site for the participants.
- Click on
Change.
Changing a participant's site will associate all their collected or future data with the newly assigned site.
Set as Test Participant
This feature is only available for licensed studies.
You can change the type of a participant from Main to Test. This is useful when you want to test a licensed study
with a test participant account but you joined the study as a main participant. See the
Participant Type section for more details on these two types of participants.
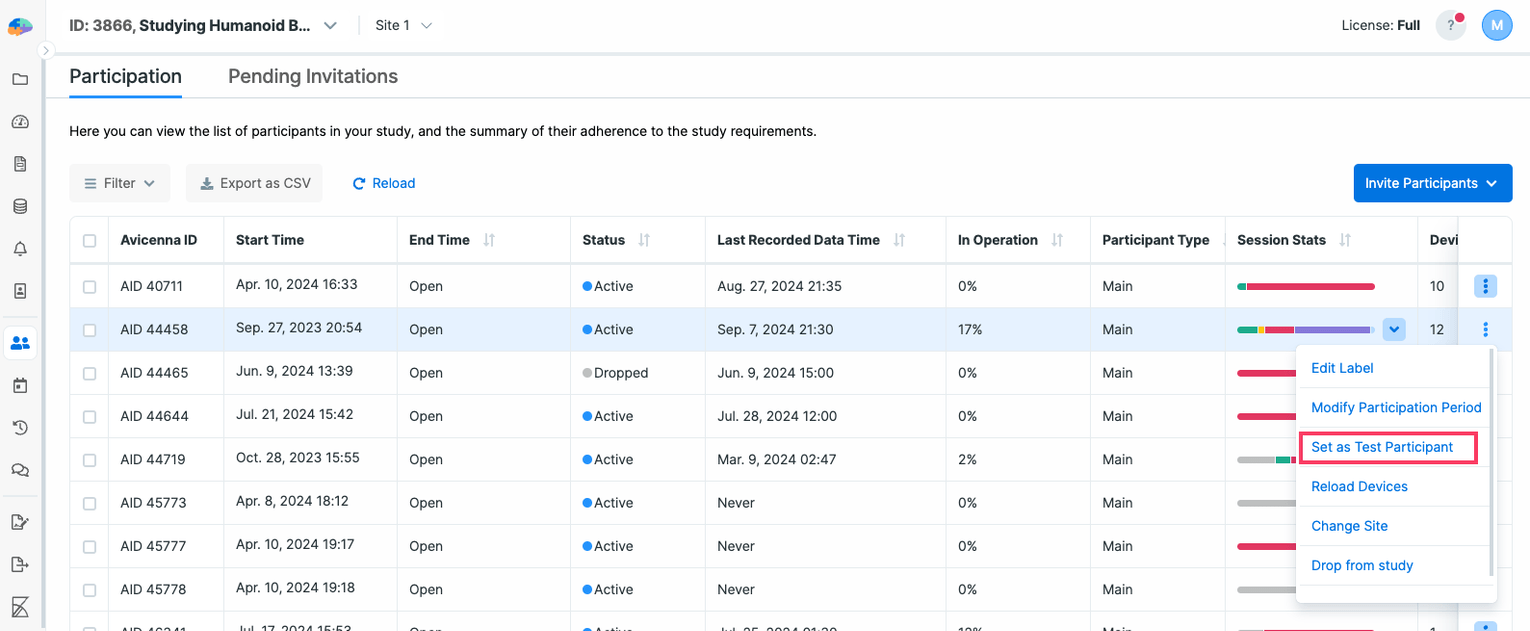
You can only change the participant type within the first three days after the participant's Join Time, and you cannot change this for anonymous, dropped, or dropped-out participants.
The action is irreversible and you cannot change a test participant back to a main participant. If you want to change a test participant to a main participant, you need to delete the test participant. In this case, the participant will lose all their data and will have to join and start from scratch as a main participant.
Reset Participation
This feature enables you to start a participant's participation from scratch. This feature is available for both researchers and participants but with different conditions and limitations.
The participants' participation can only be reset during the study's participation period.
When a participant's participation is reset, Avicenna will:
- Delete all data collected from the participant.
- Update their participation start/end time based on the study's settings.
- Update their join time to the current time.
- Retain their label and site assignment.
This action cannot be undone. All data collected from the participant will be permanently deleted.
Reset Participation by Researcher
As a researcher, you can reset the participation of active participants in your study.
You cannot reset the participation of:
- Anonymous participants
- Participants in studies with eligibility surveys
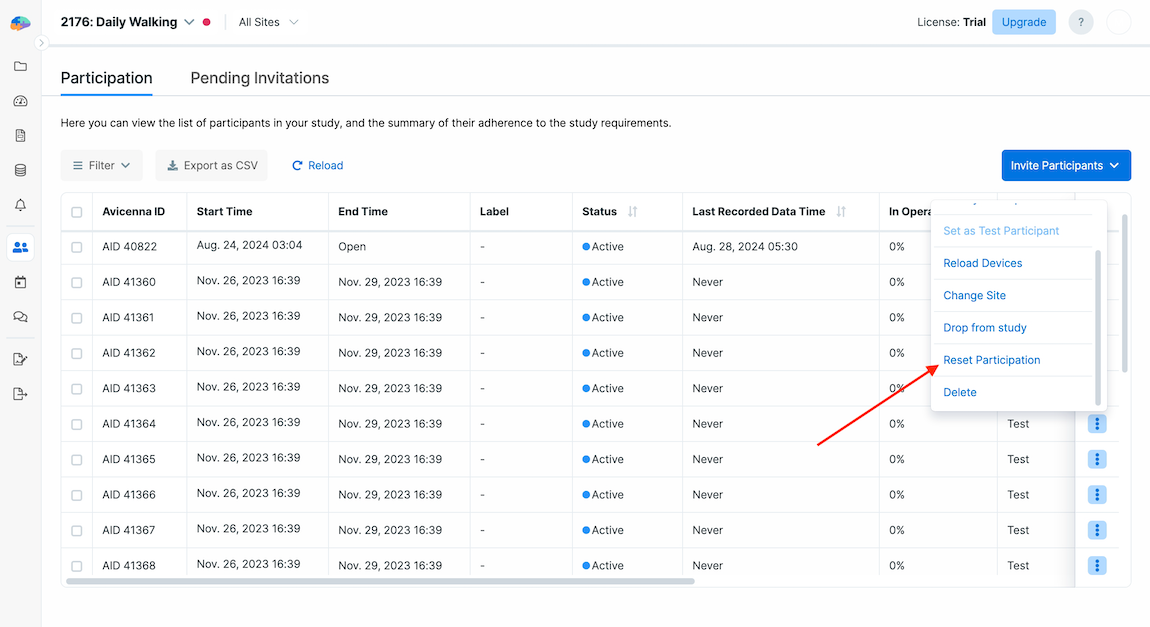
To reset a participant's participation:
- Find the intended participant.
- Click the 3-dot menu next to their entry.
- Select "Reset Participation".
- If your study has enabled the "Capture Reason for Changes" feature, provide a reason for this change.
- Confirm the action in the dialog that appears.
Reset Participation by Participant
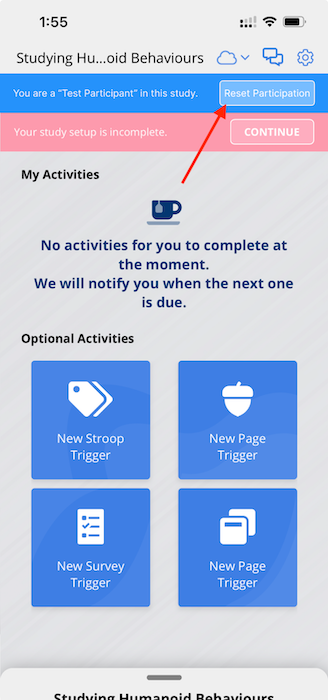
Participants can also reset their own participation, but only under specific conditions. They must be active test participants regardless of the study's enrollment type.
To do that, they need to click on the Reset Participation button in the banner at the top of the study's homepage and
confirm the action.
Drop from Study
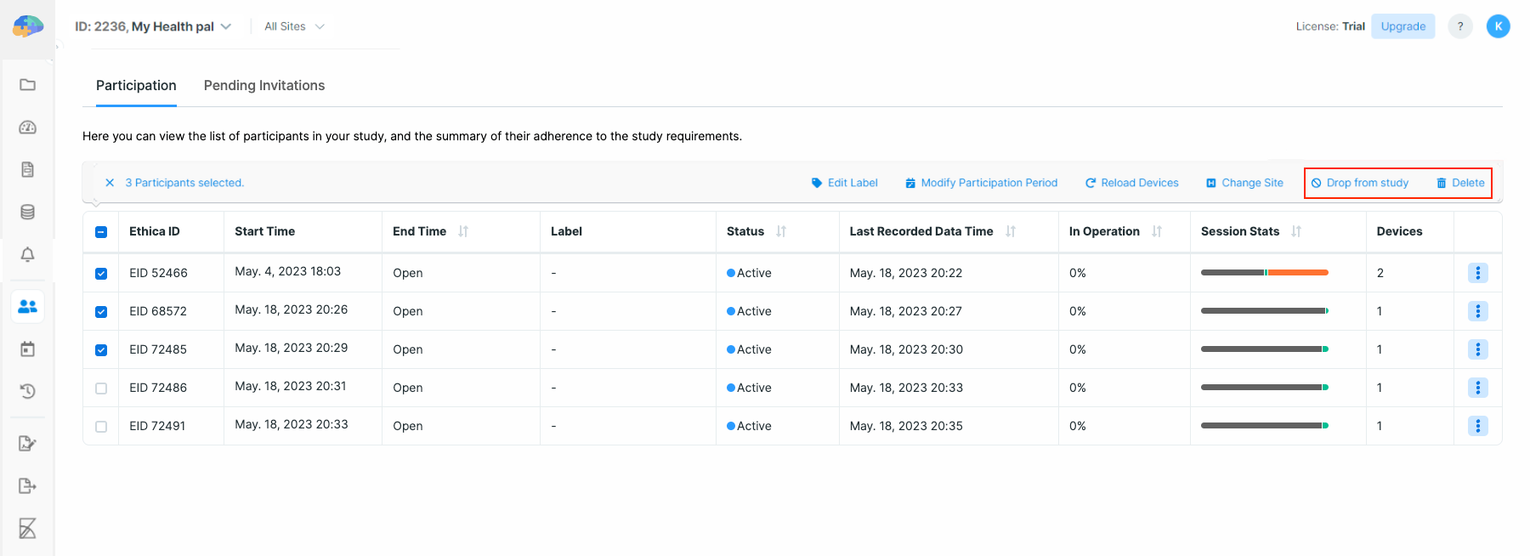
You can choose to exclude one or more participants from the study. This will stop all data collection immediately and
remove the study from their app (you may need to reload participants' devices). To drop a participant from the study,
you just need to select the participant, click on the Drop from Study button, and confirm. For more details on
dropping out of a study, you can refer to the Study Dropout section.
Delete from Study
This option allows you to remove a given participant from the study, and delete all their associated data as well. In
this case, Avicenna will delete the participation record for this participant, any collected sensor data, and any
collected Activity data as well. To delete participants from your study, you need to select one or more participants and
then click on the Delete button.
The participant may join the study again. If the study is invitation-based, they will need a new invitation to join the study. Also, if they join the study again, Avicenna will consider them as a new participant and recalculate their Participation Period.
Capture Reason for Changes in Participants' Data
Researchers can enable a feature that will force them to provide reasons for any changes that affect participants' data, including modifying the participation period, changing labels or sites, dropping them from the study, editing survey responses, etc. This provides transparency and accountability, empowering researchers to validate the integrity of any modifications.
To enable this feature for your study, navigate to the Basics page of the researcher dashboard. On that page, click on
Edit, and then on the Edit Study dialog, enable Capture Reason for Changes. By default, the feature is disabled.
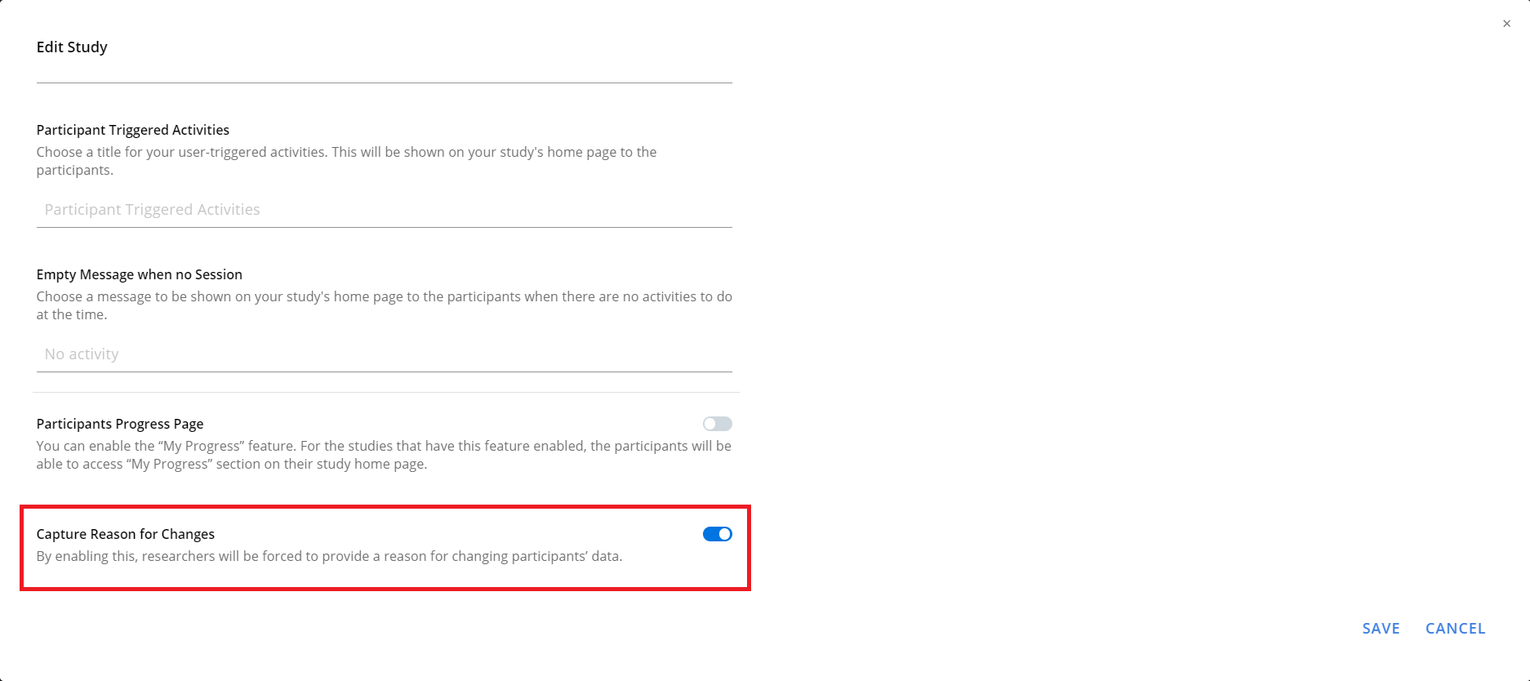
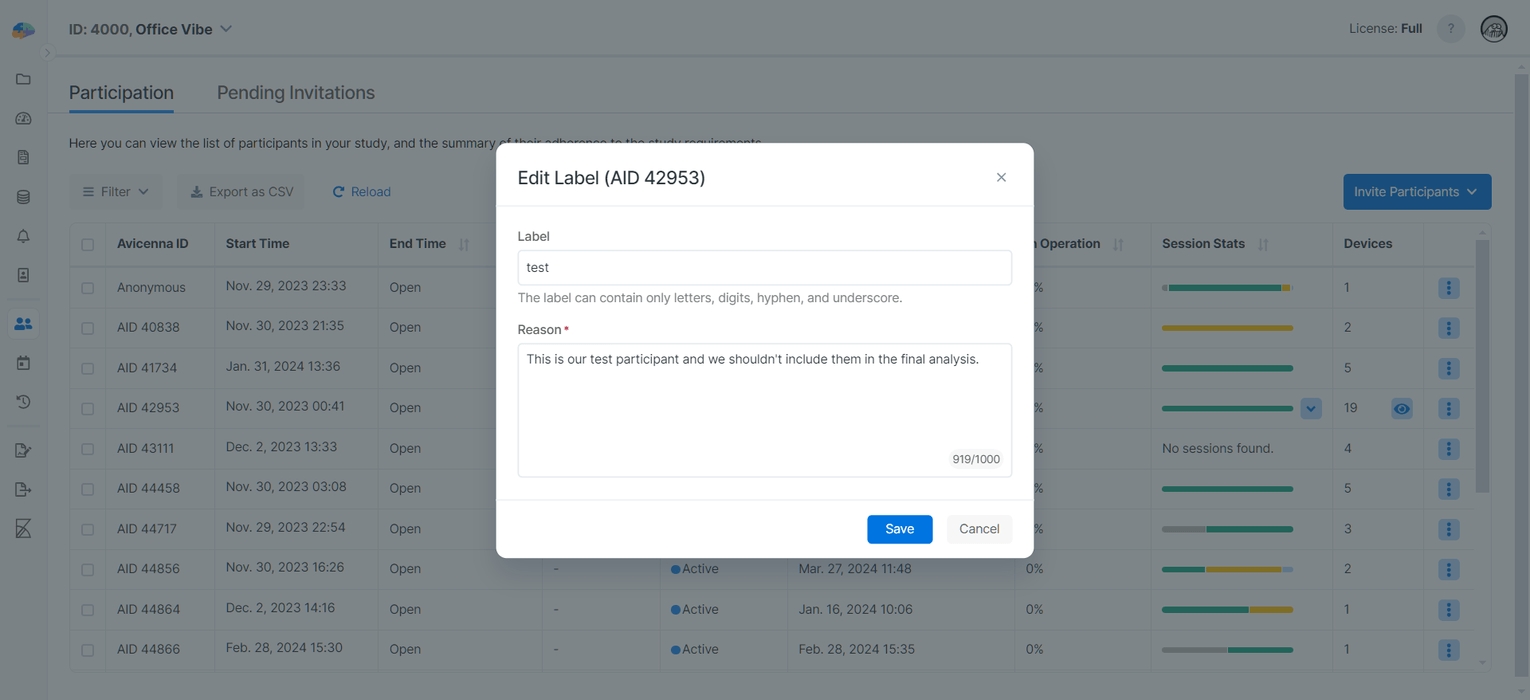
Once enabled, researchers must provide reasons for changes made to participants' data. For example, the following image shows that editing a participant's label requires a Reason now:
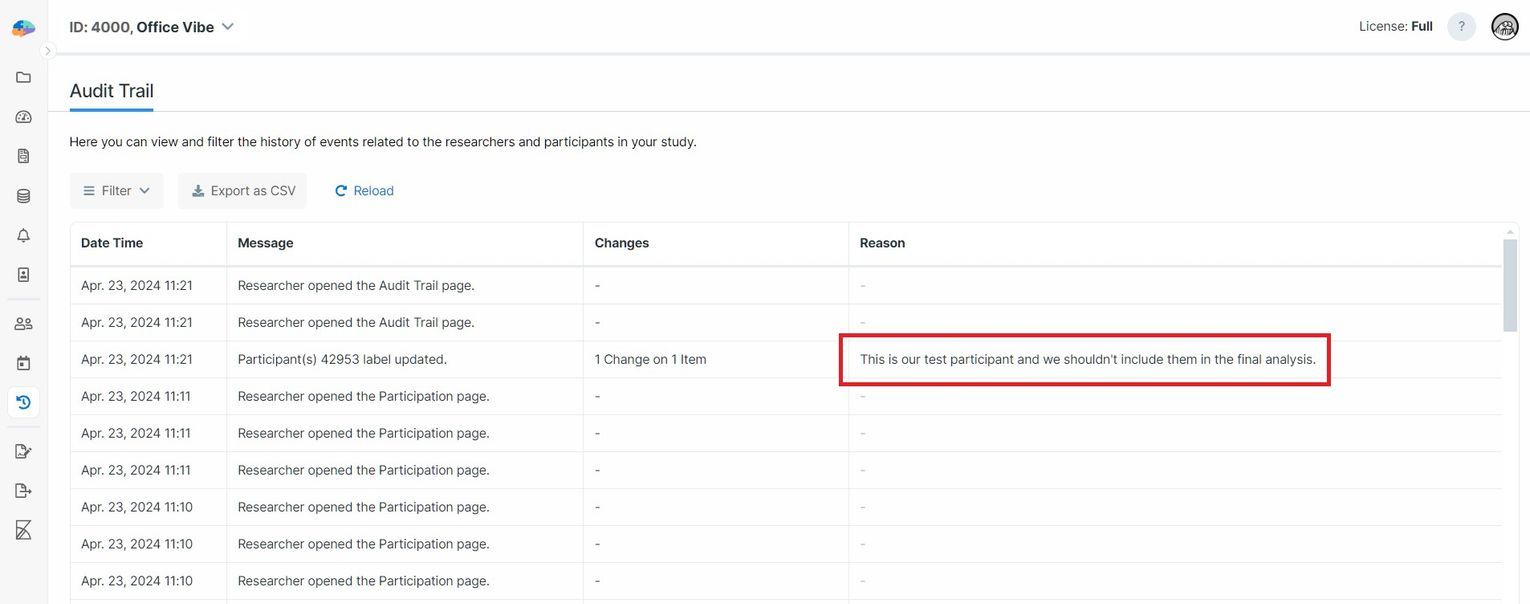
Reasons are recorded as part of the audit logs along with the changes made to the participants' data. See the following image for the recorded Reason we wrote when changing the participant's label:
Show Participants' Personally Identifiable Information (PII)
By default, Avicenna does not show participants' PII to researchers. Avicenna allocates a unique ID to each new participant and uses this identifier to store their data in the database. This ID is used throughout the platform to reference participant data, ensuring personal details like names and email addresses are stored separately from study-related data and remain inaccessible.
However, study owners can choose to display participants' personal information for all researchers of the study. To
enable PII visibility, navigate to the Basics page of the researcher dashboard. Click on Edit, and then on the
Edit Study dialog, enable PII Visibility.
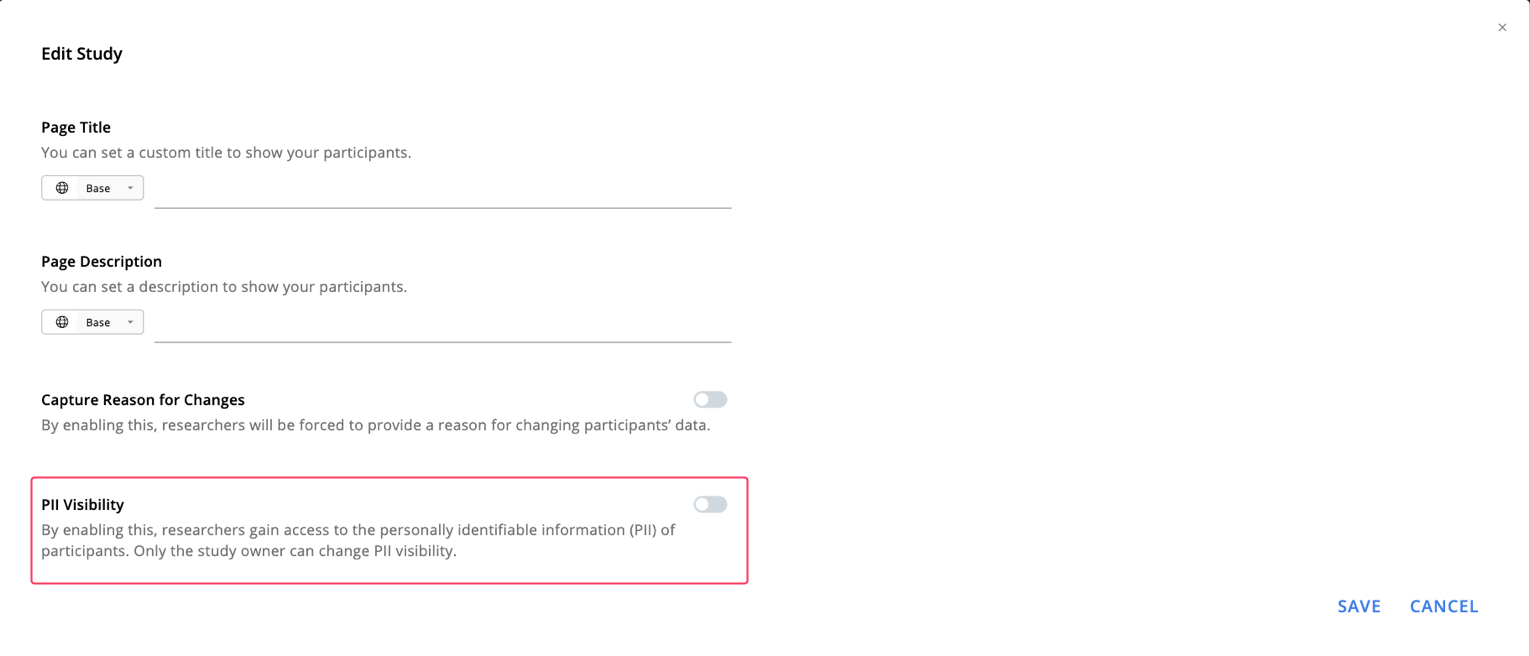
Once enabled, you can see some of the participants' PII on the Participation page or the corresponding exports. This
includes the participant's first name, last name, and email address.
Troubleshooting
General steps to diagnose participation issues
- Ensure that the participant is really part of your study. You might want to temporarily enable PII visibility and look for them by their email address or name.
- If the participant is using the Avicenna mobile app, make sure the app is the latest version. Simply check the App Store or Google Play and update the app if a new version is available.
- Make sure that your participant's device date/time and their timezone are set correctly. Preferably, they should be set to automatic.
- Check the participant's participation start/end time instead of the study's participation start/end time and see if that might have caused the issue.
- If you don't see the expected data on the researcher dashboard or the exported/downloaded file, double-check the selected site (if your study is multi-site) and the applied filter, if any. Note that some filters can be more complex and exclude some columns/metadata.
- In case you modified the study or anything related to the participant (for example, you adjusted their participation period or even deleted their registration), check if the participant actually got the new changes since then. You can do this by finding the "Registration Read" audit logs for the corresponding participant. If the participant is using the mobile app, you can send a request to reload the study on the participant's app. But if the participant is using the web app, they can simply refresh the page.
- If you expected some responses or sensor data from the participant, make sure they successfully uploaded them. You
can do this by finding the "Data Sync Ended",
"Automatic Data Upload Finished",
and
"Automatic Activity Response Upload Finished"
logs. If your participant is using our mobile apps, you can ask them to try syncing the data manually (again) by
going to the
Settingspage and tapping theSync Dataoption. - Related to the previous item, if the participant was using the mobile app, check if they might have logged out of the app, cleared the app cache, or simply uninstalled the app while they were offline. We won't be able to detect and log these cases.
- If the participant is using the mobile app and the above steps didn't help, you can ask the participant to sign out of the app and log back in. If that didn't work either, they can upload/sync all their current data and only then reinstall the app.
- If the participant is using the web app, check if the issue is related to their browser.
Study is finished but I still receive responses/data/logs from the participant or the participant still receives sessions/notifications
- Check if the participation period for that specific participant hasn't finished yet. You might have adjusted the study's participation period or duration after the participant joined the study. We don't adjust the participation periods for already-enrolled participants in such cases. You might want to adjust the end time for that participant.
- The same is true if you simply change the Enrollment Type to
Closed. That will only prevent new participants from joining your study; it won't affect already-enrolled participants. - Check the general steps to diagnose participation issues.
I can't find the participant, but I receive extra data (e.g., responses) from another participant
This might indicate that two participants (probably partners) are using the same account for whatever reason.
Note that each participant in Avicenna has a unique Avicenna ID; two participants can't have the same ID.
Also, you might want to check the general steps to diagnose participation issues.